|
SN10k - how to collect signaling traces
Posted by Michal Podoski, Last modified by Daniel Lizaola on 20 December 2017 12:48 PM
|
|
|
During internetworking related debugging it may be required to use more detailed siangling data then those offered by WebPortal ' Start data collection1. Log into the SN10k CLI via SSH protocol using ' mpodoski@sandbox:~$ ssh [email protected] 2. In the ' Welcome to your SmartNode powered by SmartMedia 3. The ' Welcome to your SmartNode powered by SmartMedia 4. ' Capture signaling traces 1) Set protocol Allows you to toggle between connected protocol monitors. By default all available signaling stacks [ALL=Y] will be monitored. In order to change this behavior disable the ALL option by pressing 8 and confirming with Enter. You will notice the protocol selection list next to ' 1) Set protocol [ALL=N][SS7=N][ISDN=N][LAPD=N][CASR2=N][SIP=N][IP=N][H248=N]
From this point on you can select the signaling stacks you whish to monitor or re-enable [ALL=Y] option, which will take precedence over other configuration 2) Set capture format Is used to configure the output file format of sigtrace appliaction. Similar to "Set protocol" this is a toggle like menu. 1) CAP
Controlls the output file format. In case it's enabled data will be written to a CAP file designed to be opened in libpcap running applications (fe. Wireshark). When set to NO sigtrace data is written to a text file (not recommended when contacting Patton Support). 2) Old ISDN CAP
By default this option is disabled, causing ISDN data to be collected on LAPD layer (ISDN L2 for D channel), which in SN10k is transported over IP. Some cases of low layer debugging require to collect data with some HDLC information (fe. direction of the Msg). Enabling the "Old ISDN CAP" option will deliver such data. 3) Extended CASR2 (with call state)
Controls insertion of cirtuit states into PCAP file for CAS R2 signaling. 3) Regroup entity of same type Puts all similar signaling monitor outputs in one file. Be advised that unfortunately ISDN Trunks as treated as separate signaling entities. 4) Start capture This is I believe self explanatory.
5. After issuing '
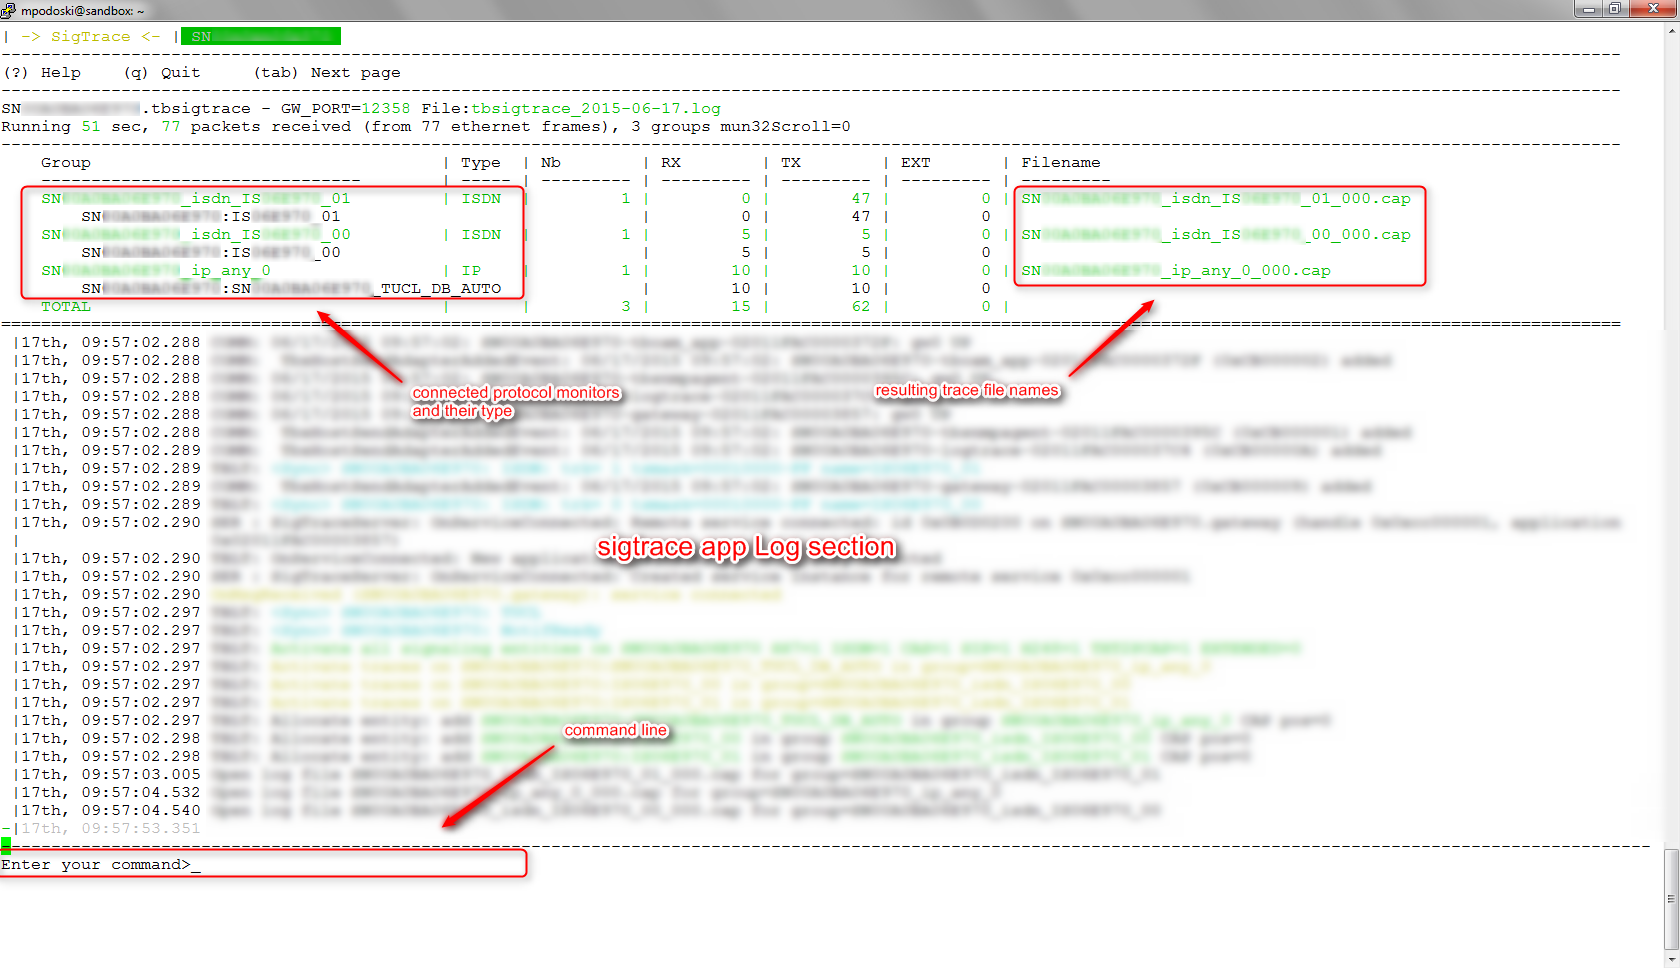
Please be sure that after launching, the sigtrace application contains required protocol monitors in the connected section. Otherwise please restart the application!
6. After reproducing the required scenario sitgrace application needs to be terminated. Please press "q" button when the sigtrace status window is active. Following line shoud appear in the command line. Are you sure you want to quit application? NO
Type "YES" and press Enter Are you sure you want to quit application? YES
This will cause sigtrace application to terminate and signaling traces to be copied into 'download' user home directory Wait signaling traces capture to complete...
Feel free to terminate the '
7. In order to obtain collected logs, please login to 'download' user account using SFTP protocol connection. mpodoski@sandbox:~$ sftp [email protected] After listing the contents of the directory you will be able to find 'sigtraces.tar.gz' among other files sftp> ls -laht Archive will contain all of the previously captured traces.
| |
|
|